
Conversion rate optimization means improving the percentage of website visitors who take the action you want.
That action could be a purchase, a form fill, a phone call, or an email signup. The math is simple:
Conversion Rate = (Conversions ÷ Total Visitors) × 100
If 1,000 people visit your site and 25 buy, your conversion rate is 2.5%. Raise that to 3.5% and you earn 40% more revenue from the same traffic.
The gap between those two numbers comes down to friction. Slow pages push visitors out.
Long forms tire them. Weak calls to action confuse them. Missing trust signals scare them off.
CRO removes each friction point one by one. Faster pages. Fewer form fields. One clear button.
A visible review above the fold. These small changes move your numbers without touching your ad budget.
Raise Your Conversion Rate Without Spending More on Ads
Traffic without sales is just a number. Now, millions of websites pull visitors daily but lose them before a single action happens.
Slow pages, crowded buttons, zero-trust signals, and eight-field forms silently push buyers out. That is a friction problem, not a traffic problem.
Conversion rate optimization fixes exactly that. The gap is not luck. It is speed, clear messaging, mobile-first design, and tested trust signals working together.
The businesses closing that gap now are not spending more. They are wasting less. Small friction fixes compound fast.
A shorter form, a faster page, one focused button, and a well-placed review can shift your numbers within weeks.
My elder sister ran a small e-commerce store selling home decor items. She got decent traffic but almost no orders.
She called me, frustrated, saying her ads were draining her budget with nothing to show for it. I checked her site and found three problems in under ten minutes.
The product page loaded in 7 seconds on mobile, the checkout had eight steps, and there were no customer reviews anywhere.
We fixed the load time, cut checkout to three steps, and added twelve product reviews.
Her conversion rate went from 0.8% to 2.6% in five weeks. Same traffic. Same products. Same ad budget. That is exactly what conversion rate optimization does.
2026 Benchmarks You Need to Know
Average conversion rate across all industries: 2.9%
Top 10% of websites: over 11.45%
E-commerce average: 1.81% to 2.7%
Lead generation landing pages: 11.9%
Source: WiserReview CRO Report 2026 and SQ Magazine Benchmarks
A 2.9% rate is not a win. It is a starting point. The distance between average and top performers is enormous, and that distance is where conversion rate optimization lives.
Why Most Websites Convert Poorly in 2026
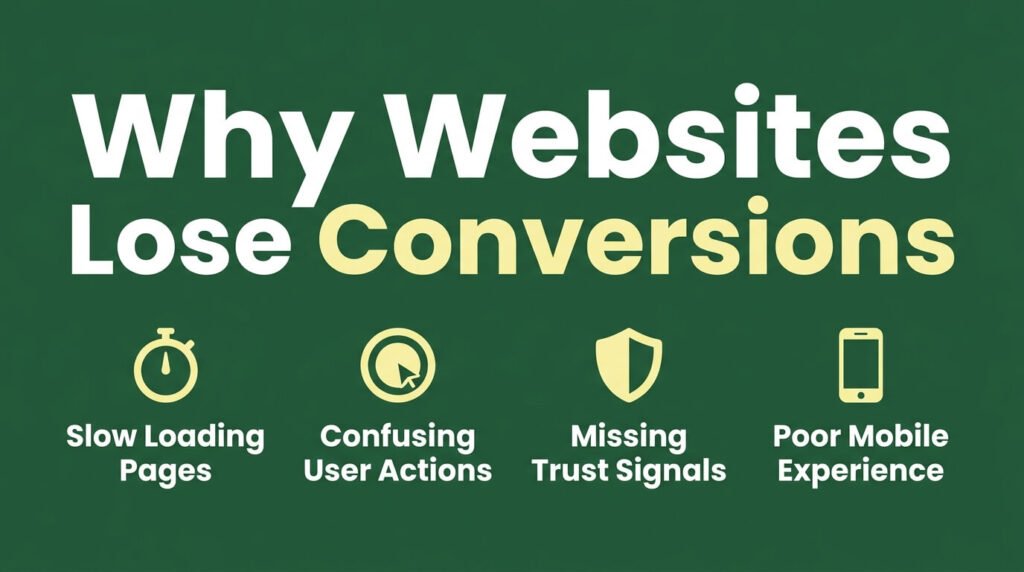
Most websites fail to convert for five reasons. None are mysterious. They are just overlooked.
- Slow load time. Pages loading over 3 seconds lose 32% of conversions. A 1-second delay drops your rate by 7%.
- No clear single action. Too many buttons, menus, and links compete for attention. Visitors get confused and leave.
- Weak trust signals. No reviews, no security badges, no testimonials. Visitors do not feel safe buying.
- Bad mobile experience. 72% of website traffic now arrives on mobile devices. Yet mobile conversion rates still trail desktop by a measurable gap.
- Generic messaging. The page tries to speak to everyone and connects with no one.
Fix these five points and you are ahead of most competing sites in your category.
I helped a younger sister who runs a freelance graphic design portfolio site. Her contact form had seven fields.
We cut it to three. Inquiries jumped 34% in six weeks. No new traffic. No redesign. Just fewer fields.
Conversion Rate Benchmarks by Industry (2026)
Your target depends on your industry. Comparing an e-commerce shop to a law firm makes no sense. Let’s see where each sector currently sits:
| Industry | Average Conversion Rate | Top Quartile Target |
| Food & Beverage | 8.98% | 13%+ |
| Professional Services | 4.6% | 8%+ |
| Legal Services | 3.4% to 7.4% | 10%+ |
| Finance | 3.1% | 6%+ |
| Healthcare | 3.0% | 5.5%+ |
| E-commerce (B2C) | 2.1% to 2.7% | 5%+ |
| SaaS / Software | 1.1% to 1.8% | 4%+ |
| E-learning | 2.0% to 3.0% | 5%+ |
| B2B E-commerce | 1.8% | 3.5%+ |
| Commercial Real Estate | 2.7% | 5%+ |
Source: ElectroIQ CRO Statistics 2026 and The Frank Agency Industry Data
The 7 Core CRO Tactics That Work Right Now
Most websites do not have a traffic problem. They have a conversion problem. Visitors arrive and leave without acting.
The page either slows them down, confuses them, or fails to earn their trust.
These seven tactics fix each of those gaps directly. Each one comes from current data.
Each one works without increasing your ad spend. Start from the top and work down.
1. Fix Page Speed First
Speed is the foundation, not a finishing touch. Google’s data shows pages loading in 1 second convert 3 times higher than pages loading in 5 seconds.
Focus on your Largest Contentful Paint (LCP) score. Get it under 2.5 seconds.
Use Google PageSpeed Insights to find what slows each page. Compress images, drop unused plugins, and move to faster hosting if needed.
2. Write One Clear Headline Above the Fold
Your visitor decides to stay or leave within 3 seconds. Eye-tracking data shows 57% of viewing time goes above the fold.
That first headline must state exactly what you offer and who it helps. A simple formula: Desired outcome + Time frame + Main objection removed. Nothing clever. Just clear.
3. Cut Your Forms Down
Every extra form field drops completion rates by 4% to 8%. The right number for B2B lead gen is 3 to 4 fields.
For e-commerce email capture, 1 to 2 fields works best. Multi-step forms work even better for complex information because they feel less overwhelming at the start.
4. Place Trust Signals in the Right Spots
Testimonials, review counts, security badges, and certifications reduce buyer hesitation.
But placement matters as much as having them at all. Placing a trust badge directly above your call-to-action button can lift conversions by 20% or more. Do not bury social proof in the footer. Put it where the decision happens.
In 2026, trust signals with specific numbers and real names lift conversions 18% to 32% more than generic praise. “I saved $1,200 using this service” works far harder than “Great service!”
5. Design for Mobile First
72% of visitors arrive on phones. Build your checkout, forms, and landing pages for a 390px screen first.
Tap targets need to be at least 44px. Text needs to be at least 16px. Horizontal scrolling kills mobile conversions. Test on actual phones, not just browser previews.
6. Use One CTA Per Page
Multiple calls-to-action confuse visitors. Every extra button competes with your main goal. The highest-converting pages use one primary action, repeated at multiple scroll points.
Remove header navigation from landing pages. Remove footer links. Give the page one job.
7. Add Chat Support
Adding live chat increases revenue by up to 40% and lifts conversions by up to 48%. Visitors with a quick question who get an instant answer are far more likely to buy.
In 2026, AI-powered chat handles routine queries around the clock. An exit-intent chat prompt catches hesitant visitors at exactly the right moment.
A/B Testing: The Right Way to Test Changes
A/B testing means showing two page versions to different visitors and measuring which converts better. Most businesses do it wrong.
The biggest mistake: Calling a winner too early. You need at least 95% statistical significance before acting on any result. Declaring a winner at 60% confidence is not a result. It is noise.
How to Run a Good A/B Test
- Test one variable. One headline. One button color. One CTA phrase. Never three things at once.
- Run the test for at least 2 full weeks to capture day-of-week patterns.
- Require 95% statistical confidence before calling a result.
- After the test, ask why the winner won. That answer feeds your next test.
- If you have under 1,000 monthly visitors, skip A/B testing for now. Watch session recordings and fix the obvious problems first.
A/B testing drives up to a 49% increase in conversions, yet only 44% of companies use it. That gap is your advantage right now.
A senior marketing manager who hired me and asked to check why her SaaS signup page was underperforming.
We ran an A/B test on one button label: “Start Free Trial” against “Get Instant Access.” The second won by 22%.
Session recordings showed the reason: users hovered on the trial button, then scrolled to check pricing.
The word “trial” made them expect a catch. One word change. No redesign. A 22% lift.
CRO Tool: Which One Fits Your Stage
You do not need fifteen tools. Two or three that you use every week will do more than ten you ignore.
| Tool | Best For | Free Option | Paid Starting Price |
| Google Analytics 4 | Traffic and full-funnel analytics | Yes | Free |
| Microsoft Clarity | Heatmaps and session recordings | Yes | Free |
| Hotjar | Behavior tracking and user surveys | Limited | ~$39/mo |
| VWO | A/B testing for sites with 1,000+ monthly visits | No | ~$199/mo |
| Optimizely | Enterprise A/B and multivariate testing | No | Custom |
| Google PageSpeed Insights | Page speed and Core Web Vitals | Yes | Free |
| Looker Studio | Reporting dashboards | Yes | Free |
If your budget is tight, start with GA4 plus Microsoft Clarity plus a simple spreadsheet test log.
That covers analytics, behavior tracking, and test documentation, all free. Add a paid testing tool only when your traffic can support statistically valid tests.
The CRO Sequence That Compounds Results
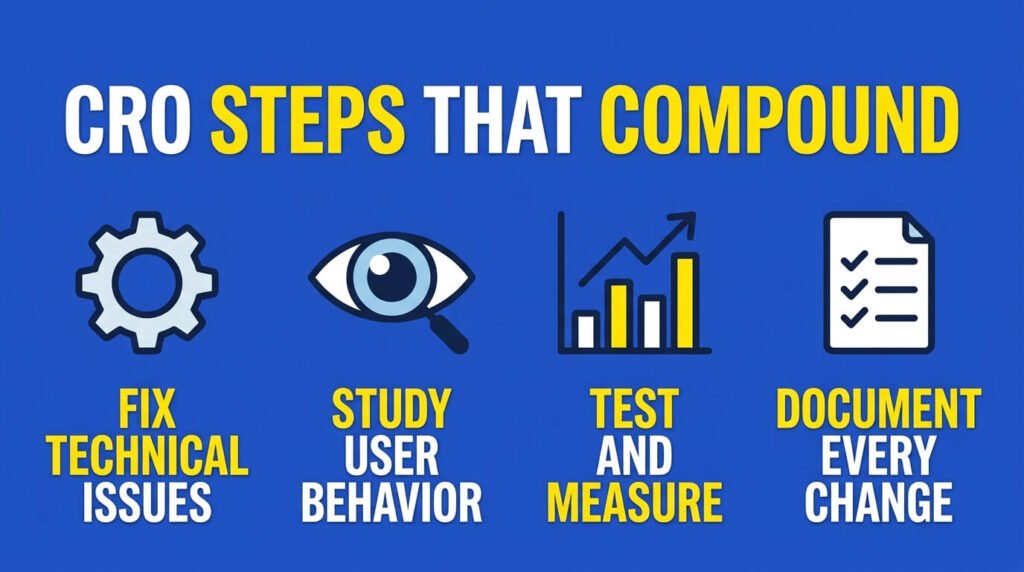
Do not fix everything at once. Work in this order to get fast wins and build a repeatable system:
- Fix technical barriers first. Page speed, mobile rendering, broken links, crawl errors. These block everything else you try.
- Study user behavior. Watch at least 20 session recordings before forming any hypothesis. You will see exactly where people drop off.
- Fix the biggest friction point. Forms, slow pages, cluttered CTAs. Pick one and fix it.
- Run a test. Validate the fix with data before rolling it to all pages.
- Document every result. Record what you changed, why, and what happened. This builds a playbook you can repeat.
- Repeat. CRO compounds. Each win makes the next one faster to find and easier to act on.
Structured CRO programs produce 30% to 80% conversion lift within 90 days. Source: Net Partners CRO Playbook 2026
In 2026, search behavior adds one more layer to this sequence. AI systems like Google AI Overviews and ChatGPT now answer queries before users click.
Visitors who reach your site from AI-cited results arrive with stronger intent. They already got a partial answer.
They come to verify and act. That makes them easier to convert. To attract those visitors, structure your content.
Landing Page CRO Checklist for 2026
Run through this before launching any page or campaign:
- Page loads in under 2.5 seconds on mobile (check LCP in PageSpeed Insights)
- Headline states the offer and the audience in one sentence
- One primary CTA button, repeated at multiple scroll points
- Form has 3 or fewer fields (B2B) or 1 to 2 fields (e-commerce email capture)
- At least one specific, named testimonial visible above the fold
- Trust badges or security icons appear near the CTA
- No site navigation menu on dedicated landing pages
- Images compressed and served in next-gen formats (WebP, AVIF)
- Mobile tap targets are at least 44px
- FAQ section present with schema markup applied
- GA4 tracking confirms the conversion event fires correctly
- Heatmap tool installed to capture first-week visitor behavior
I audited a service page for a friend who runs an online fitness coaching business.
The page had a strong offer but five different CTAs: “Book a call,” “Download my plan,” “See pricing,” “Chat with me,” and “Get a free audit.”
Visitors had no idea what to do first. We removed four and kept only “Get your free audit” at three scroll points. Bookings doubled in the first month, with no change to traffic or ad spend.
What ROI Should You Expect from CRO?
Companies using CRO tools see an average ROI of 223%. Some report returns over 1,000% after a full optimization program.
The CRO software market moves toward $1.93 billion by the end of 2026, growing at 10% per year. That growth reflects one thing: it works.
A mid-sized online retailer moving from 2.5% to 3.0% conversion gains 20% more revenue without changing their ad budget.
For a site doing $2M in annual revenue, that is $400,000 in additional income from the same traffic. The math always favors fixing conversion before adding more ad spend.
Final Takeaway
Thus, fix speed. Remove friction. Build trust. Test one thing at a time. Record every result. The gap between a 2% and a 5% conversion rate is rarely a product problem or a traffic problem. It is a friction problem.
Every section in this guide points to a specific friction point you can remove this week.
Pick the one that matches your biggest current loss, fix it, measure it, and move to the next. That is how the gap closes.
The best time to start was before your last ad campaign ran. The next best time is right now.
FAQ
What is the difference between bounce rate and conversion rate?
Bounce rate measures visitors who leave without clicking anything. Conversion rate measures visitors who complete a specific action.
A page can have a low bounce rate and still convert poorly. Someone reads three pages and leaves without buying. That is not a conversion. Track both separately. They tell different stories.
Does changing button color actually improve conversions?
Sometimes. But color alone rarely drives big lifts. What matters more is contrast and visibility.
A button that stands out from the page background gets clicked more. A green button on a green page disappears. Test contrast before testing color. That is where the real difference sits.
Should every page on my site be optimized for conversion?
No. Only pages with a clear single goal need CRO attention. Your blog posts build trust and attract traffic.
Your about page builds credibility. Your product page, service page, and landing pages convert. Focus your CRO work on pages where a visitor has buying intent.
How does exit-intent technology work and does it help?
Exit-intent tools detect when a visitor moves their cursor toward the browser close button. At that moment a targeted message appears.
It could be a discount, a free resource, or a simple question. Websites using exit-intent popups report conversion increases of 2% to 5% from visitors who would otherwise leave with no action taken.
Can too much personalization hurt conversion rates?
Yes. Personalization that feels intrusive damages trust fast. Showing a visitor their exact location or referencing their browsing history too directly feels surveillance-like.
Effective personalization now matches content to traffic source or device type. It feels helpful, not tracked. Keep it subtle and relevant to the page goal.
What is the fastest single fix most sites can make today?
Add one specific customer result above the fold. Not a generic five-star rating. A named person, a measurable outcome, and a time frame.
“Sarah cut her checkout time by 40% in three weeks” outperforms “Customers love us” on every test. Specificity builds trust in seconds. That trust converts.

Aliza Khatun is a Digital Marketing Professional and the founder of DigiGenHub. She has helped various businesses grow their online presence through real-world experience in marketing, branding, traffic growth, and business strategy.
Through DigiGenHub, she shows how to build and grow a business from the ground up using Website Setup, SEO, Branding, Paid Promotion, and smart digital tools.
She also highlights how AI can be used to its full potential to make content creation, automation, marketing, and business growth faster and smarter.
She believes that the right knowledge, modern technology, and the right tools can help any individual or business build a stronger online presence.