
Running a business is all about balancing growth, costs, and value creation. The hoped-for ROI mostly depends on cost structure. Still, what is cost structure in business model canvas?
Among the nine core Business Model Canvas (BMC) blocks, cost structure maps all the costs needed to run your business.
A clear Business Model Canvas gives founders direction, confidence, and financial purpose from day one. Most businesses still treat costs as a setup task.
That single habit creates silent losses that compound fast. A remote client ran a small e-commerce store. She never revisited her cost structure after launch.
By month eighteen, untracked fees had quietly wiped 22% of her profit. Today, AI helps 87% of companies achieve cost reductions, with businesses across all industries cutting operational costs by up to 30%.
But AI also adds new cost lines. Organizations now spend an average of $1.2 million on AI-native apps, a 108% year-over-year jump. That means your cost structure needs revisiting more often, not less. Map it. Track it. Adjust it as conditions shift.
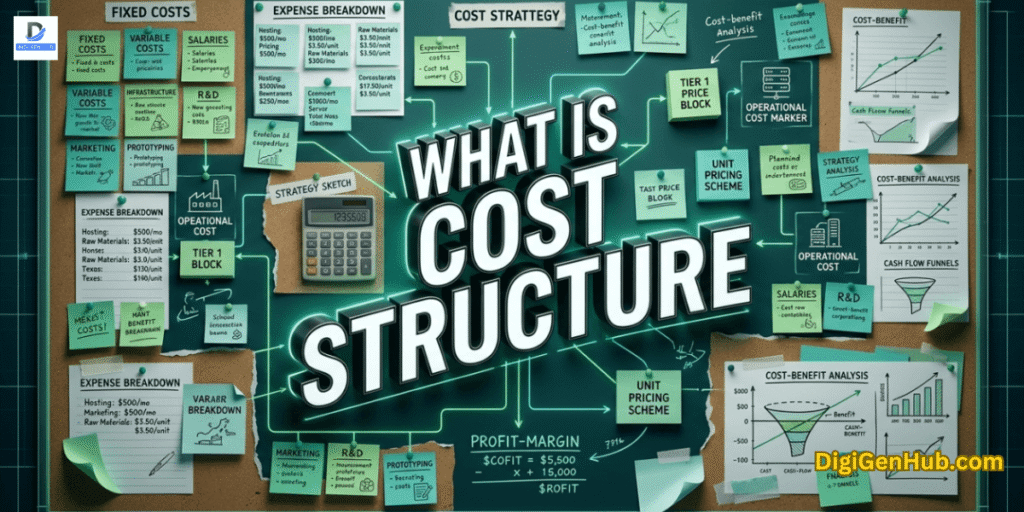
What is Cost Structure in Business Model Canvas?

The Cost Structure shows the total costs a business needs to operate. It includes both fixed and variable costs. These costs are necessary to create value for customers and run the business.
Definition and Role
Cost Structure = All costs a company pays to operate.
Role: Helps manage expenses and ensure profits.
Resource Allocation
Businesses use fixed costs (e.g., salaries, rent) and variable costs (e.g., marketing, production) to deliver value. Smart allocation of resources creates better value while controlling costs.
Example (SaaS Business):
Fixed costs = $50,000 per month.
Variable costs = $10 per customer.
If 1,000 customers are acquired:
Total cost = $50,000 + ($10 x 1,000) = $60,000.
Cost per customer = $60,000 ÷ 1,000 = $60.
Balancing these costs well helps the business stay profitable.
Growth Advantages: Scale & Scope
Most businesses stumble onto economies of scale by accident. The smart ones plan for it from day one.
Let’s explain how it works. Your fixed costs stay the same as production grows. But each unit absorbs a smaller share of that cost.
A $10,000 monthly rent spread across 1,000 units costs $10 per unit. Spread it across 10,000 units and that drops to $1. Same rent. Ten times the output. That gap is where margin is built. Source, MasterClass
Economies of scope work differently. When products share the same distribution channel or need similar marketing messages, the cost of running each product line falls.
A software company selling both a CRM and invoicing tool to the same audience pays one sales team, runs one support channel, and earns from two products. Source, goodreads
Both advantages are available to almost every business. Most just never deliberately target them.
One warning worth taking seriously: scaling requires continuous investment in organizational structure and compliance. It is not just production capacity.
Ignore internal and external costs while scaling and the benefits erode fast. Bigger doesn’t automatically mean cheaper. It means cheaper if your systems keep up. Source: Financial Models Lab
The Hidden Costs That Quietly Drain Profitability
Every cost structure has two layers. The visible one rent, salaries, ad spend gets tracked. The hidden layer runs quietly until a review delivers a painful surprise.
Small, frequent expenses accumulate and damage budgets. Cutting costs too aggressively hurts quality and customer satisfaction. Underestimating variable costs causes budget overruns.
And failing to review costs regularly means the business never adapts to what’s actually changed.
The data is blunt. Cash flow problems sink 29% of startups. And 82% of businesses that failed in 2023 couldn’t manage their finances effectively. That’s not a revenue problem. It’s a cost visibility problem. Source: Founders Forum Group
The fixes are practical. Audit every subscription regularly. Negotiate better terms before contracts auto-renew. Outsource non-core work instead of hiring full-time in early stages. Keep a cash buffer not just for growth, but for normal operations.
Two tools that make this easier without needing a finance team: Wave handles bookkeeping for small businesses for free.
Bench pairs you with a real bookkeeper and flags spending patterns monthly. Neither requires an accountant on payroll.
How Agentic AI Is Rewriting Cost Structures in 2026
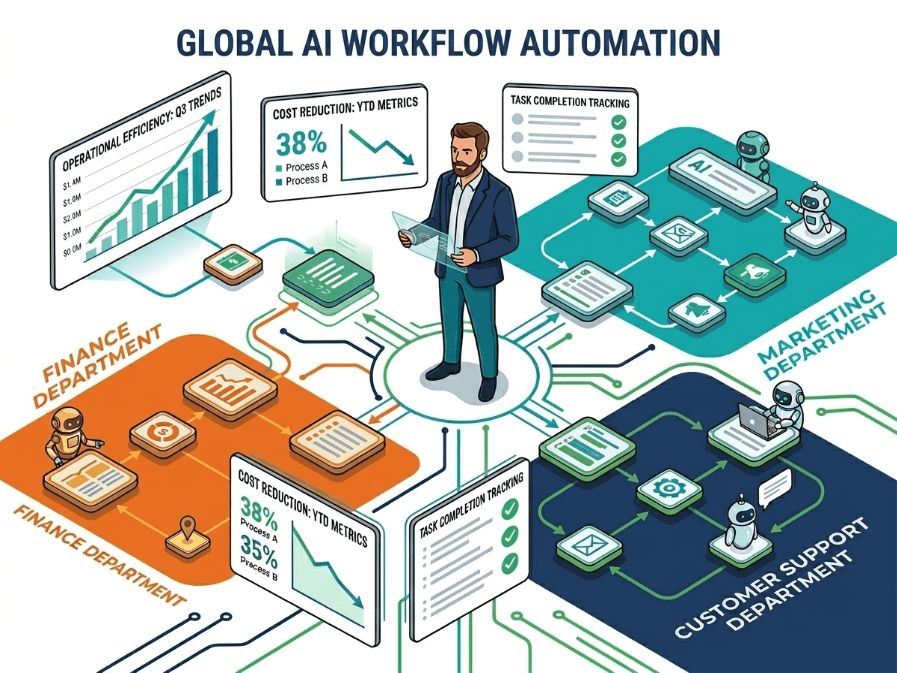
Standard automation saves time on a single task. Agentic AI can handle entire workflows. It completes multiple steps and makes decisions without waiting for human input at every stage.
The impact on costs is significant. Companies using agentic AI have reduced operating costs by up to 38% while increasing productivity across marketing, customer support, finance, and internal operations. These results come from real deployments, not future estimates. Source, barchart
Organizations report a 30% cost reduction through faster AI-enabled response times. In multi-step workflows, agentic AI cuts human task time by up to 86%.
For context, traditional single-step automation typically saves 20–30% of time on one task. The jump to multi-step autonomous agents changes what’s achievable entirely. AI Stratagems
KPMG reports that companies using AI agents see 55% higher operational efficiency and an average cost reduction of 35%.
That combination of higher output, lower cost directly expands margins without requiring a single new customer. Neurons Lab
What changes in your cost structure? Labor-heavy operational costs shift from unpredictable variable expenses to manageable fixed technology costs.
A support team handling 200 tickets daily becomes one person overseeing an AI system handling 2,000.
But the PwC 2026 AI Predictions report adds an important caution: agents can now do roughly half of what people currently do.
But this requires new governance to manage both risks and outputs. Businesses that treat agentic AI purely as a cost-cutting lever without building governance structure will find the savings short-lived. PwC
The Business Model Analyst’s guide on AI workflow automation breaks down exactly which BMC blocks shift when AI enters your operations. Worth reading before you restructure anything.
Your Cost Structure Needs a Review Schedule, Not Just a Setup
Most businesses define their cost structure once — at launch — and never revisit it. That’s where quiet losses begin.
Around 38% of startups fail because they run out of cash. A significant portion of that isn’t caused by weak sales. It’s costs that were never re-examined as the business changed. ABC BootCamps
A simple review schedule prevents most of this:
- Monthly — track variable costs against budget
- Quarterly — review fixed costs, catch contracts worth renegotiating
- Annually — remap the full cost structure against your current revenue model
Top-performing startups spend 45% less time fixing financial models after adopting automated scenario testing tools. Building this habit early helps you avoid costly surprises later.
For live financial modeling, Causal makes it easy to test different scenarios using real numbers. Mosaic connects directly to your accounting data and tracks cost trends in real time.
For collaborative Business Model Canvas planning, Strategyzer keeps your cost structure connected to the rest of your business model. It was also created by the founder of the Business Model Canvas framework.
Cost Structure and Profitability
Mapping the cost structure helps businesses identify areas for cost reduction. This ensures accurate cost allocation and improves profitability by focusing on per-unit costs and cost trends.
1. How a Purposeful Cost Structure Helps in Cost Reduction
By breaking down costs, businesses can spot inefficiencies and reduce unnecessary expenses.
Example:
A subscription-based online business identifies high server maintenance costs. So they count:
Monthly server cost: $5,000
After optimization: Cloud provider cost drops by 20% → $4,000.
Cost saved = $1,000/month → Increases profitability.
2. Role of Financial Analysts in Accurate Cost Allocation
Financial analysts ensure all costs are correctly allocated to products, services, or departments. This is essential for pricing and maintaining profitability.
Example:
A business has 2 central departments: Marketing and Operations.
Total monthly overhead: $10,000
Analyst allocates 60% to Marketing ($6,000) and 40% to Operations ($4,000).
This allocation ensures that each department’s profitability is accurately assessed.
3. Mapping Per-Unit Costs and Cost Trends
Businesses can adjust pricing or operations to improve profitability by counting per-unit costs.
Example:
Product cost: $30/unit
Fixed cost: $5,000/month
If they sell 200 units/month, the total cost is:
Variable cost per unit: $30 → Total variable cost = $6,000 (200 units × $30).
Total monthly cost = $11,000 ($6,000 + $5,000).
Per-unit cost = $11,000 ÷ 200 units = $55/unit.
If the business raises the price by 10% ($55 → $60), profit increases by $5/unit.
Primary Blocks of the Business Model Canvas and Cost Calculation
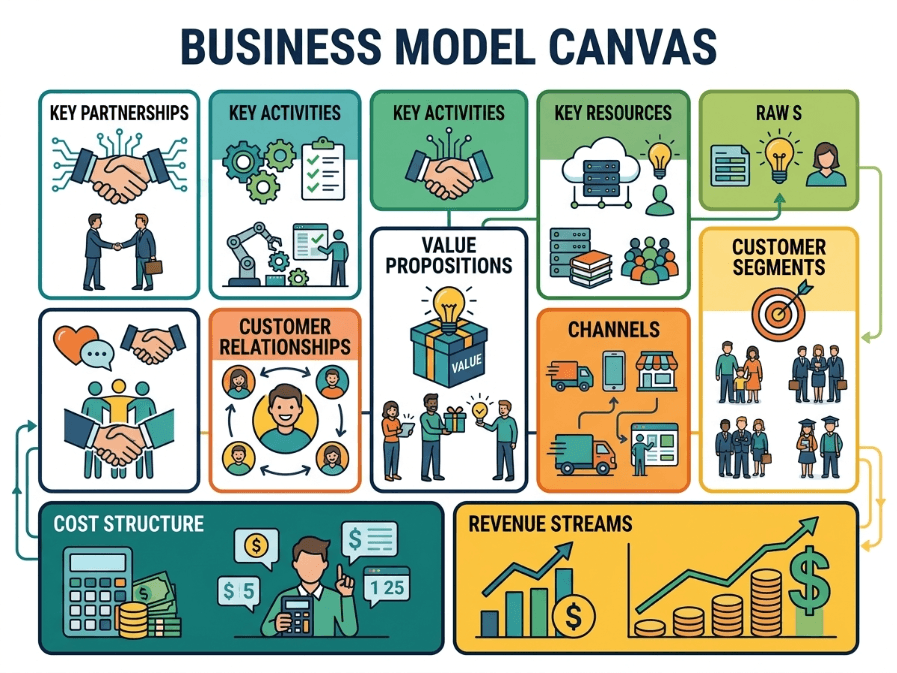
The nine Business Model Canvas (BMC) blocks shape how a business runs. These are:
Customer Segments – Who are your customers?
Value Propositions – What value do you offer them?
Channels – How do you reach and deliver value to them?
Customer Relationships – How do you interact with customers?
revenue streams business model canvas– How do you make money?
Key Resources – What assets are crucial for your business?
Key Activities – What must you do to deliver your value?
Key Partnerships – Who are your external partners and suppliers?
Cost Structure – What are the costs involved in running the business?
Still, each block directly affects costs. Let’s explain:
How They Relate to Costs?
- Customer Segments & Channels → More ads & marketing spend (35%).
- The average CPC for Search Ads is $2.69, while Display Ads average $0.63 (storegrowers.com).
- Value Proposition & Product Development → Higher content & innovation costs (10%).
- Key Resources & Activities → Need tech, AI, automation (25%).
- Companies implementing AI automation have reported average cost reductions of 12% over the next five years (copy.ai).
- Customer Relationships → CRM, support, & email campaigns (15%).
- Key Partnerships → Lower in-house costs, but partner fees apply.
How do Businesses Calculate Costs?
To explain this part, definitely follow this visionary way:
Ad Spend Calculation (35%)
If a company invests $10,000 in ads, $3,500 goes to customer acquisition.
ROI Check: If the cost per click (CPC) is $2.69, they get 3,500 / 2.69 = 1,300 clicks.
If 3% convert, they get 39 customers.
Tech & digital tools or AI Costs (25%)
AI automation cuts labor by 40%, but AI tools cost $2,500/month.
Example: Chatbots reduce support staff, saving $5,000/month (cloudester.com).
Customer Retention Costs (15%)
$1,500/month in email, CRM and loyalty programs.
Retaining a customer is 5X cheaper than acquiring a new one.
AI & CRM tools can reduce customer support costs by 25% (ft.com).
Hence, a well-planned cost structure means higher profits & scalability.
Business Model Canvas Cost Structure Example
The Cost Structure shows where your money goes and helps you manage expenses. Let’s explain the different types of your cost structure. A well-planning of these allows you to make better decisions and plan for the future:
Comparison of Focal Cost Types in Business Model Canvas
| Cost Type | Definition | Example | Calculation & Impact |
| Fixed Costs | Costs that stay the same no matter what | Rent = $5,000, Salaries = $10,000 | Total = $15,000/month = 30% of monthly revenue ($50,000 |
| Variable Costs | Costs that change with sales/production | Materials = $500, Shipping = $200 | Total = $700 (for 100 units). Per unit cost = $7/unit = 14% of revenue |
| Semi-variable Costs | Costs that have both fixed and variable parts | Utility bill = $100 (base) + $1/unit | Total = $600 (500 units). More use = higher cost |
| Direct Costs | Costs linked directly to making the product | Material = $10/unit, Labor = $5/unit | Direct cost for 100 units = ($10 + $5) x 100 = $1,500 = 30% of revenue |
| Indirect Costs | Costs not tied to a product but needed to run the business | Admin Salaries = $3,000, Rent = $2,000 | Total = $5,000/month = 10% of revenue |
| Operational Costs | Everyday costs to run the business | Rent = $5,000, Salaries = $4,000 | Total = $9,000/month = 18% of revenue |
| Capital Costs | One-time costs for assets that last a long time | Machinery = $50,000 (Depreciated) | Annual Depreciation = $10,000 = 20% of capital spent per year |
| Sunk Costs | Costs that can’t be recovered | $5,000 spent on a failed ad campaign | No impact on future decisions; irrelevant for future planning |
1. Fixed Costs in Business Model Canvas
Let’s know why fixed costs matter for profitability:
Stability
They provide predictability in cash flow. You know your minimum expenses each month.
Efficiency
A business can improve profit margins by reducing fixed costs without increasing sales.
Main Areas to Manage Fixed Costs
| Fixed Cost Type | Example | Impact on Profitability |
| Rent | Office space | High fixed cost; long-term lease |
| Salaries | Staff wages | Consistent cost; can’t easily cut |
| Software Licenses | Marketing tools | Ongoing, necessary cost for operations |
2. Variable Costs in Business Model Canvas
Why Variable Costs Matter for Profitability:
Scalable
As sales increase, costs rise—but the business can adjust quickly.
Control
If variable costs are high, profitability drops. Lowering them boosts profit margins.
Central Areas to Manage Variable Costs
| Variable Cost Type | Example | Impact on Profitability |
| Materials | Raw materials for products | Increases in production volume |
| Shipping | Delivery costs | Increases with order size |
| Marketing Spend | Pay-per-click ads | Increases in ad spend/traffic |
3. Semi-variable Costs (Mixed Costs) in Business Model Canvas
Why Semi-variable Costs Matter for Profitability:
Fixed Component
Ensures a minimum cost even if there’s no usage.
Variable Component
Increases as usage grows, which can be controlled.
Primary Areas to Manage Semi-variable Costs
| Semi-variable Cost Type | Example | Impact on Profitability |
| Utility Bills | Base + usage (e.g., water) | Fixed baseline + usage increase |
| Employee Overtime | Fixed base salary + overtime | Can increase based on the workload |
| Telecom Services | Monthly fee + usage charges | Can grow with customer demand |
4. Direct Costs in Business Model Canvas)
Why Direct Costs Matter for Profitability:
Pricing Strategy
The more direct costs, the higher the product price is needed to maintain profit.
Cost Control
Efficient management of direct costs directly raises profitability.
Main Areas to Manage Direct Costs:
| Direct Cost Type | Example | Impact on Profitability |
| Raw Materials | Ingredients for food | Directly impacts production cost |
| Labor | Worker wages | Increases with higher production |
| Manufacturing Costs | Equipment, energy | Fluctuates with production levels |
5. Indirect Costs in Business Model Canvas
Why Indirect Costs Matter for Profitability:
Fixed nature
They don’t change with production levels, so they must be controlled.
Operational efficiency
Reducing indirect costs increases profit margins without affecting sales.
Vital Areas to Manage Indirect Costs:
| Indirect Cost Type | Example | Impact on Profitability |
| Rent | Office space | Fixed cost, hard to change |
| Utilities | Electricity, internet | Increases with usage |
| Salaries | Admin staff | Fixed, essential for operations |
6. Operational Costs in Business Model Canvas
Why Operational Costs Matter for Profitability:
Cash Flow Impact
High operational costs reduce available funds for growth and investment.
Efficiency
Lower operational costs improve overall profitability without increasing sales.
Key Areas to Manage Operational Costs:
| Operational Cost Type | Example | Impact on Profitability |
| Marketing | Online ads, campaigns | Can be optimized for better ROI |
| Salaries | Staff not involved in production | Fixed cost; efficiency matters |
| Software | CRM, email tools | Can be scaled based on the need |
7. Capital Costs in Business Model Canvas
Why Capital Costs Matter for Profitability:
Upfront Investment
These costs affect cash flow immediately but lead to long-term benefits.
Depreciation
Capital assets lose value over time, affecting financial reporting and future investment.
Vital Areas to Manage Capital Costs:
| Capital Cost Type | Example | Impact |
| Equipment | Machinery, tools | High upfront cost but increases production efficiency |
| Property | Office or factory space | Long-term investment with fixed costs |
| Vehicles | Delivery trucks | High initial cost, but essential for logistics |
8. Sunk Costs in Business Model Canvas
Why Sunk Costs Matter for Profitability:
Irrelevant for Future Choices
Past spending doesn’t affect future profitability.
Avoiding the Fallacy
Don’t let sunk costs influence decisions, such as continuing a failed marketing campaign to recover previous losses.
Specific Areas to Manage Sunk Costs
| Sunk Cost Type | Example | Impact on Profitability |
| Failed Campaigns | Marketing ad spend | Past spending is irrelevant to future decisions |
| Expired Inventory | Unsold stock | Investment already lost can’t be recouped |
| R&D Expenses | Unsuccessful product development | Don’t continue investing if not profitable |
How Cost Structure Affects Business Decisions
In online businesses, cost structure is critical in shaping operations, pricing and long-term strategy decisions. The particularity lies in the perspective of cost-driven vs. value-driven business models.
1. Cost-Driven Business Models
These models focus on minimizing costs. The goal is to offer low-cost products/services by optimizing processes, automating tasks and reducing overheads.
Example:
Online marketplaces like Amazon use automation, AI and logistics optimization to reduce shipping costs.
Cost to ship a product: $4 per item
Reduction after optimization: 20% → $3.20 per item
2. Value-Driven Business Models
These models focus on delivering high value, even if it means higher costs. Premium features, better customer experience and top-quality products are prioritized.
Example:
Netflix: Offers exclusive content and seamless streaming, justifying a higher subscription fee.
Cost per user: $10
Revenue per user: $15, maximizing value rather than minimizing cost.
Cost Allocation and Its Importance
Cost allocation assigns business costs to specific products, services, or departments. It helps businesses understand where their money is going and ensures accurate pricing and profitability analysis.
How Businesses Assign Costs
Businesses allocate costs based on cost pools and allocation bases.
Example: Online Business Cost Allocation
| Cost Pool | Allocation Base | Total Cost | Allocated Cost |
| Overhead | Labor Hours (300 hrs) | $6,000 | $3,000 |
| Maintenance | Machine Hours (100 hrs) | $5,000 | $2,000 |
| Marketing | Direct Allocation | $2,000 | $2,000 |
Conclusion
Thus, proficiency in designing a well organized cost structure work most to cut costs and build a strong foundation. With wise moves, you’ll enhance profits, grow faster and make your business vigorous.
FAQ
How to calculate costing?
Total Cost = Fixed Costs + (Variable Costs × Sales)
Cost Per Unit = Total Cost ÷ Units Sold
Adjust with automation to reduce costs by 20%.
How does cost structure differ between physical product and digital businesses?
Physical businesses have higher operating costs. They pay for materials, equipment, storage, and shipping.
Digital businesses usually have higher setup costs. These include development and software infrastructure. After that, the cost of serving each new customer is very low.
Today, many founders build digital businesses with simple tools, automation, and no-code platforms. In many cases, one more customer adds almost no extra cost.
That is the biggest advantage of digital businesses. The challenge is different. If growth is slow, fixed technology costs can become a burden.
What compliance costs are businesses missing from their cost structure in 2026?
Many businesses still overlook compliance costs.
Industrial companies face higher environmental and regulatory expenses. Operating costs are expected to rise as new rules take effect.
Digital businesses face different risks. Software licensing audits are becoming more common. Many companies now face unexpected costs after audits.
Do not wait for penalties. Include compliance costs in your budget from the start.
How do you calculate your actual break-even point from your cost structure?
Use this formula:
Break-even = Total Fixed Costs ÷ (Selling Price per Unit − Variable Cost per Unit)
The result shows how many sales you need to cover all costs.
This number matters because lower fixed costs reduce your break-even point. That means you can reach profitability with fewer customers.
What is the difference between a cost pool and a cost allocation base?
A cost pool is a group of related expenses. For example, overhead costs.
A cost allocation base is the method used to distribute those costs. Examples include labor hours, machine hours, or transaction volume.
Choosing the wrong allocation method can distort profitability. One department may look profitable while another appears unprofitable, even when the numbers are misleading.
Many small businesses skip this step and end up with inaccurate pricing.
Can a business have healthy revenue but a broken cost structure?
Yes. It happens often.
Strong revenue can hide cost problems for a long time.
If revenue grows by 30% but costs grow by 45%, the business is moving in the wrong direction.
Many businesses fail because costs rise faster than revenue.
Track revenue growth and cost growth separately. Both numbers matter.
What is marginal cost and when does it matter in cost structure planning?
Marginal cost is the cost of producing one more unit.
It becomes important when you add customers, take more orders, hire staff, or expand operations.
If marginal cost stays below your selling price, growth improves profits.
If it rises above your selling price, profits shrink.
This often happens when overtime, rush shipping, or emergency purchases increase costs.
How do you build a cost structure for a business that hasn’t launched yet?
Start with three categories.
First, list setup costs. These include equipment, legal fees, and development.
Second, list fixed monthly costs. These include rent, salaries, and software.
Third, estimate variable costs for each sale.
Be conservative with your estimates. Early costs are often higher than expected.
Also build a 90-day cash reserve. Your available funds should cover at least 90 days of expenses, even if revenue is zero.
Create three financial scenarios: best case, expected case, and worst case.
What tools are most reliable for tracking and mapping cost structure in 2026?
For financial modeling and scenario planning, Causal is a popular choice.
For tracking costs with live accounting data, Mosaic works well.
For Business Model Canvas planning, Strategyzer remains the leading option.
For free bookkeeping, Wave covers most needs for small businesses.
Modern tools also provide recommendations and planning insights. They help businesses make faster and more informed decisions than traditional spreadsheets.

Aliza Khatun is a Digital Marketing Professional and the founder of DigiGenHub. She has helped various businesses grow their online presence through real-world experience in marketing, branding, traffic growth, and business strategy.
Through DigiGenHub, she shows how to build and grow a business from the ground up using Website Setup, SEO, Branding, Paid Promotion, and smart digital tools.
She also highlights how AI can be used to its full potential to make content creation, automation, marketing, and business growth faster and smarter.
She believes that the right knowledge, modern technology, and the right tools can help any individual or business build a stronger online presence.