
If you want to improve marketing, you must know exactly how to do audience research on Facebook.
The process is simple. Start with tracking tools like Pixel and Conversion API. Use Business Suite and Ads Manager to find the numbers that matter.
Check what your followers save, when they show up and which posts they share. Look across Instagram, test small groups and then scale what works. Each step gives you a clear picture of the right audience.
I saw this happen with my aunt’s bakery business. She sold cakes online, but her ads brought the wrong people. Many clicked, but few ordered.
I studied her Facebook audience, checked which posts got reactions and focused ads on people who engaged with videos.
Within weeks, she reached buyers who cared. Her online orders started to grow.
How to Do Audience Research on Facebook
Audience research on Facebook today is about action, not just broad stats. It is about what people like, what they save and what they ignore.
When you follow each step, your content feels closer and your ads reach the right people.
The platform’s AI-driven ecosystem makes research precise if you use the right setup. Businesses that skip steps often waste ad spend and miss high-value groups.
Following a structured process ensures you capture both the visible signals (demographics, engagement) and the hidden ones (behaviors, cross-platform overlaps). Let’s learn how to do it appropriately:
1 . Set up the right tools
Before you study your audience, your system must be prepared:
Install Meta Pixel or Conversion API
These tools track events like page views, purchases and leads. The Pixel collects browser-based data, while the Conversion API works directly with Meta’s servers. Having both ensures no data gaps, even when users block cookies.
Connect your Page to Meta Business Suite
This is your central hub for performance analytics and page-level insights. It gives you demographics, follower growth and activity trends.
Use Ads Manager with full access
Without Ads Manager, you can’t tap into deeper Audience Insights or create advanced custom audiences.
Link Instagram accounts
Facebook and Instagram audiences overlap heavily. Linking both helps you study cross-platform behaviors.
Integrate CRM or first-party data
If you own customer data (emails, purchase records), import it. This creates high-value custom audiences and powerful lookalike segments.
Setting these up first ensures your research is based on accurate and comprehensive data, not partial signals.
2 . Where do you find audience insights?
Once your tools are active, you can begin exploring audience data:
A . In Business Suite → go to Insights → select Audience. This shows demographics, follower activity and engagement trends.
B . In Ads Manager → “Analyze & Report” → Audience Insights. Here, you can study interests, behaviors and build potential audiences.
C . In Page Insights → open Posts. You’ll see what time your posts perform best and which formats work.
D .In video posts → check “Retention Graphs.” This shows how long people watch and where drop-offs occur.
Rely on all of these. Do not depend on one tool alone. Each view fills in a different piece of the audience puzzle.
3 . Analyze your current followers
A . Start with the people who already follow and engage with you:
B . Review age, gender and location breakdowns.
C . Identify top cities, states, or countries where engagement is strongest.
D . Track peak activity times to know when to post or launch ads.
E . Check growth trends — are you gaining or losing followers and from where?
F . Spot engaged sub-segments (for example, women 25–34 in Texas responding strongly to Reels).
G . Compare active engagers vs silent followers. Engaged users are your real core.
This base analysis shows who you have now and where the opportunities are.
4 . Build and test potential audiences
Research does not stop with current followers. You need to model and test new groups:
A . Create Custom Audiences from actions such as video views, post reactions, or form opens.
B . Build Lookalike Audiences from custom groups to expand reach to similar people.
C . Test interest + behavior filters such as “fitness + video watchers + online shoppers.”
D . Use exclusions to avoid overlap and prevent ads from targeting irrelevant users.
E . Run A/B tests with micro audiences (100k–500k). Identify what works, then scale the winners.
Small, controlled testing ensures you spend less while learning more.
5 . Use Meta Pixel for real behavior data
The Meta Pixel and Conversion API provide insights no page metric can:
A . Track on-site actions such as View Content, Add to Cart and Purchase.
B . Build audiences from those actions. Example: users who added items to the cart but did not purchase.
C . Adjust time windows (7 days vs 30 days) for fresher targeting.
D . Ensure the Conversion API is running. It saves tracking data when browser-based methods fail.
E . Study pixel paths to see which posts or ads led to real conversions.
This connects your Facebook activity with actual business outcomes.
6 . Check post-level insights
Your content tells you what your audience values most:
A . Track shares, saves and comments. These carry more weight than likes.
B . Compare across formats: Reels, carousels, link posts.
C . In videos, analyze retention curves. Where viewers drop off tells you about interest levels.
D . Study which captions, hooks, or visuals consistently trigger engagement.
This shows the type of content your audience cares enough to interact with.
7 . What are your audience’s hidden interests?
Not everything shows up in plain demographics. Hidden interests often reveal untapped niches:
A . View public profiles of engaged followers. Notice other brands, books, or hobbies they follow.
B . Use Pages Liked by This Audience in Audience Insights to see unexpected overlaps.
C . Check overlap graphs to see which interests consistently appear together.
D . Look for repeating patterns like fans of certain TV shows, hobbies, or local pages.
These insights can inspire new content angles and ad hooks.
8 . Layer cross-platform data
Audiences don’t live on Facebook alone. They interact across platforms:
A . Review the Instagram audience overlap. Many users follow brands on both apps, but engage differently.
B . Compare with YouTube or TikTok to see broader content trends.
C . Import merged data into analytics dashboards to connect behaviors.
D . Use UTM parameters to trace which platform drives the most engagement or conversions.
Cross-platform data gives you a 360° view of your customer.
9 . Discover content gaps via CrowdTangle
Competitor performance is an important clue:
A . Track top-performing competitor content.
B . Identify formats or themes they use that you don’t.
C . Spot ignored or underused angles — these are openings for you.
D . Set alerts for your niche to catch emerging trends before others do.
This research prevents copycat strategies and helps you stay ahead.
10 . Turn research into action
Refining content strategy
Double down on formats your audience interacts with.
Apply themes discovered through hidden interests.
Publish at the hours your audience is most active.
Building segmented campaigns
Create micro-segments (for example, “10-second video watchers + email subscribers + hobby X”).
Use creatives tailored to each group’s interest.
Exclude overlapping audiences to prevent ad fatigue.
Testing micro-audiences before scaling
Start with small budgets on narrow groups.
Track CTR, retention and conversions within 24–48 hours.
Pause weak performers. Scale only what works.
Duplicate campaigns with tweaks for continuous testing.
Case Study: Doubling Sales via Audience Refinement
PortoTheme ran a Facebook campaign for a client last year. They built engagement-based custom audiences, then expanded with lookalikes.
They tested different creative styles. The campaign doubled client sales.
They didn’t just target interests.
They used pixel events, excluded recent buyers and leaned into UGC-style ads instead of polished ones.
By shifting budget to audiences who engaged with Reels and excluding non-engagers, conversion rates rose. ROAS improved significantly. Full case study: PortoTheme.
How Meta Business Suite Can Help You
This tool helps advertisers connect with a large group of people as if they were one person. Just like talking to someone for a few minutes, it enables you to understand them. Let’s know how it helps you research your audience better:
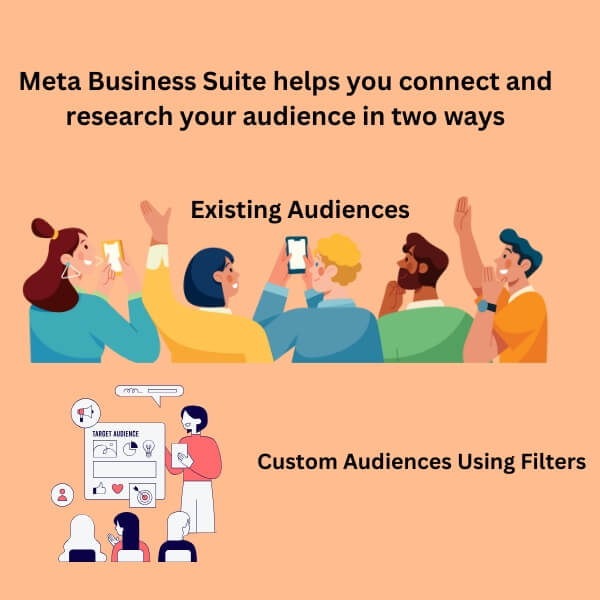
There are two primary ways to think about a large group of people:
1 . Existing Audiences: For example, people who like your Page.
2 . Custom Audiences Using Filters: You can define your audience by applying filters based on parameters like location and interests.
A . Define Your Audience
Starting from a Predefined Audience: If you already have a large audience (e.g., people who like your Page), you can begin your research there.
Reproduce Your Audience: If you don’t have a predefined audience, you can start by focusing on a specific location (like the US) and narrow it down with filters. For example, if you’re a local business, you might start with people from your town.
Interest-Based Targeting: You can further narrow the audience using interests to focus on people who are likely to be interested in what you have to sell.
B . Demographics Panel: Starting Point for Audience Research
The demographics panel is a great starting point for understanding your audience.
Age and Gender Breakdown: Check the distribution of age and gender within your audience. Does it align with your expectations, or are there surprises?
Job Types: What kinds of jobs does your audience have? This can give you insights into their lifestyle and purchasing power.
C . Adding Detail: Household and Purchase Information
Further refining your audience can be done using additional tabs like household and purchase information. These provide more color to the portrait of your audience:
Income: How much does your audience make?
Car Ownership: What type of cars do they drive?
These insights help you create a more nuanced persona of your typical audience member.
Filtering for Deeper Insights
You can filter your audience using demographic data. For example, by filtering by income (e.g., $200k—$225k), you can learn how this affects their preferences and behavior. Combining filters helps you create clear personas of key market segments, which enables you to target them more effectively.
Page Likes: Perception of Audience’s Interests
The Page Likes section shows what your audience likes. This helps you understand their interests and create better messages.
Example 1: A group of young professionals in Chicago might follow Peloton, Headspace, Glossier, Goop, and Hims. These brands show they care about wellness, self-care, and premium products. You can use this info to craft messages that match their values.
Example 2: A group in Austin (ages 25–40, $75k—$150k income) may like YETI, Warby Parker, Patagonia, Spotify, and Alo Yoga. They care about outdoor activities, eco-friendliness, and quality brands. Messaging about adventure, sustainability, and premium experiences will appeal to them.
Example 3: A group in Miami (ages 30–45, $100k—$250k income) may follow Fabletics, Sweetgreen, Uber Eats, Bumble, and The New York Times. They value convenience, fitness, and staying informed. Tailor your offers around health, productivity, and delivery services.
Crafting Personas
Building personas based on your audience’s interests helps create a stronger connection. Here are some examples:
Young Professionals Interested in Sustainable Fashion might include Everlane, Reformation, Allbirds, Patagonia, and ThredUp. These consumers care about sustainability and ethical fashion. Focus your marketing on eco-friendly and ethical fashion choices.
Example of Fitness Enthusiasts Focused on Recovery: They follow pages like Hyperice, Theragun, ClassPass, Chloe Ting, and Peloton. They care about fitness recovery. Offer products or services related to wellness and recovery.
Example of Digital Nomads and Remote Workers: They follow WeWork, Airbnb, Nomad List, Remote OK, and Productivity Hacker. They value work-life balance and travel flexibility. Offer tools for remote work and productivity.
Apply Filters for Targeting
You can use filters to target specific groups based on your product or service. This helps you reach the right people.
Example 1: If promoting a meal delivery service, target people who follow HelloFresh, Green Chef, Thistle, Whole30, and Blue Apron. These people are interested in healthy eating and would try a new, clean-eating meal service.
Example 2: For smart home products, target people like Nest, Ring, Amazon Alexa, Sonos, and Smart Home Geek. These people are tech-savvy and interested in home automation.
Audience Segmentation on Facebook
Audience segmentation helps you show ads to the right people. It makes ads more effective and helps businesses get better results.
1. Types of Facebook Audiences
Facebook has four main audience types:
New Audience: People who have never interacted with your business.
Custom Audience: People who have already interacted with your business. For example, website visitors or email subscribers.
Lookalike Audience: People who look like your best customers. Facebook creates this audience based on your existing customers.
Saved Audience: Audiences you create and save. You can use them in future campaigns.
2. How to Access the Audience Tool
A . Go to Ads Manager: Log in and click “Audiences” in the menu.
B . Create an Audience: Choose the audience type you want to create (New, Custom, Lookalike, or Saved).
C . Define Your Audience: Set filters like location, age, gender, and interests.
3. Actualize Seed Audiences
A seed audience is the base for Custom and Lookalike Audiences.
A . Custom Audience Seed: Upload a customer list or connect Facebook Pixel to your website.
B . Lookalike Audience Seed: Choose a Custom Audience. Facebook will find people similar to them.
4. Applying Filters
Filters help you target the right people. There are a few stuffs that surround this part. These are:
A . Location: Choose where your audience lives (e.g., city, country).
B . Age: Select the age group you want to target.
C . Gender: Choose male, female, or both.
D . Interests: Target people based on things they like (e.g., fitness, travel).
E . Behaviors: Target based on their actions (e.g., people who buy online).
F . Language: Target users who speak a specific language.
5. Salient Data Points to Interpret
When you create an audience, Facebook shows valuable data:
A . Demographics: Age, gender, and location of your audience.
B . Top Pages: Shows the pages your audience follows. This gives you ideas for new interests to target.
C . Locations: Shows where your audience lives.
6. Saving Audiences for Future Campaigns
Once you set up an audience, save it. You can use it again later for new ads. This saves time.
7. Optimizing Ad Targeting and Performance
To get the best results:
A/B Testing: Test different audience types to see which works best.
Refine Over Time: Keep improving your audience as you get more data.
Retargeting: Show ads to people who interacted with your business but didn’t buy.
8. Using Automation Tools
Facebook has tools to make the process easier:
Dynamic Ads: Automatically show products to people based on their actions.
Automated Rules: Set rules to adjust your budget or stop ads when needed.
Campaign Budget Optimization: Facebook will automatically spend your budget where it works best.
Case Study: Local Coffee Shop
A coffee shop used Facebook audience segmentation to increase sales. They created a Custom Audience of website visitors and added a Lookalike Audience of their best customers. Indeed, they targeted people within a 10-mile radius who liked coffee or cafes.
Results:
A . 25% increase in foot traffic.
B . 15% more sales in two weeks.
C . 10% extra conversions from retargeting.
How Each Audience Type Helps Target Specific Groups
Each audience type on Facebook helps businesses target specific groups of people more effectively. Here’s how each type works:
New Audience: Targets fresh prospects, ideal for raising awareness.
Custom Audience: Targets people who’ve interacted with your brand; great for retargeting.
Lookalike Audience: Targets people like your best customers, which is ideal for finding new high-potential customers.
Saved Audience: Targets a specific group based on detailed criteria, perfect for businesses with precise customer profiles.
By using these audience types, businesses can ensure they’re showing their ads to the right people, increasing their chances of conversion and improving ad performance.
Audience Data Breakdown on Facebook Insights
Facebook provides Audience Data Breakdown to help you understand your audience better. This data shows essential details like who your audience is, where they live, and what they like. Using this data helps you improve your ads and get better results.
1. Demographic Data
This shows basic information about your audience:
A . Age: The age groups of your audience.
B . Gender: Whether your audience is primarily male, female, or both.
C . Language: What languages does your audience speak or understand?
Why it matters: Knowing your audience’s age, gender, and language helps you target the right people. For example, if you sell baby products, you should target parents aged 25-40.
2. Geographic Data
This shows where your audience is located:
A . Country
B . State/Region
C . City
D . Local Areas (e.g., within a certain distance from your store)
Why it matters: Geographic data is key in running a local business. You can target people who live close to your store or in areas where your products are popular.
3. Behavioral Data
This shows how your audience behaves online:
A . Purchase Behavior: Are they likely to buy online?
B . Device Use: Are they using mobile phones, tablets, or desktops?
C . Activity: How often do they click, like, or comment on ads?
Why it matters: Behavioral data helps determine if your audience is ready to buy. If they often shop online, your chances of making a sale are higher.
Key Metrics: Reach, Engagement, and Performance
Facebook also gives you essential numbers to track how your ads are doing.
1. Reach
Reach tells you how many people saw your ad at least once.
Why it matters: A high reach means your ad is being shown to many people. This is important if you want to raise brand awareness.
2. Engagement
Engagement measures how people interact with your ad. This includes:
A . Likes
B . Shares
C . Comments
D . Clicks
Why it matters: High engagement means people are interested in your ad. More interaction leads to better results, like more clicks or sales.
3. Performance Metrics (ROI)
Performance data shows how well your ad is doing in terms of cost and results:
A . Cost per Click (CPC)
B . Cost per Thousand Impressions (CPM)
C . Click-Through Rate (CTR)
D . Conversion Rate
Why it matters: These metrics help determine if you’re getting good value for your money. You can adjust your campaign if you spend too much and get few results.
User Opinions and Insights
Here’s what some users say about Facebook’s data breakdown:
User Opinion 1: “We used demographic data to target women aged 30-45. Our engagement increased by 40%. This helped us reach the right customers.”
User Opinion 2: “Geographic data helped us focus on people in specific areas. We saw a 50% increase in sales in those regions.”
Case Study: Local Boutique Clothing Store
Business: A small clothing boutique for women.
Campaign Goal: Increase store visits and online sales.
Procedure:
1 . Demographics: They targeted women aged 25-45.
2 . Geography: Focused on people within 20 miles of the store.
3 . Behavioral Data: Targeted people who like fashion and shop online.
Results:
Reach: The ad reached 15,000 people.
Engagement: 7% of people engaged with the ad.
Performance: 150 online purchases and a 20% increase in store visits.
ROI: For every $1 spent, the business made $3 in return.
Conclusion
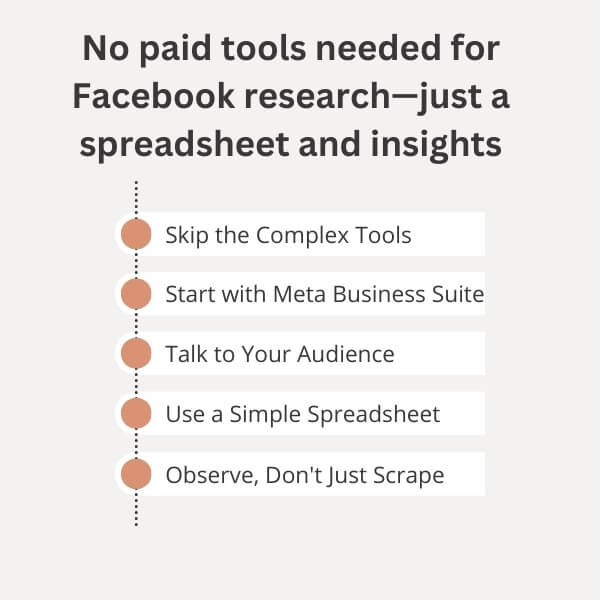
Thus, When you continuously research your audience on Facebook, you should feel like you are finding a hidden treasure. The answers are right in front of you. Now, you know that simplicity works. You don’t need fancy tools or a big budget.
You just need to listen, connect, and create content they care about. Indeed, talk to your audience. Listen to them. Let them guide you.
It isn’t quick. It took time. But soon, your audience must start to engage more. They feel heard. They will like your content.
FAQ
How do you analyze audience on Facebook?
To analyze your audience on Facebook, go to Ads Manager and click Insights. Then, select Audience from the menu on the left. This details your current and potential audience, including demographics and interests.
How do I find the audience tool on Facebook?
To find the audience tool on Facebook, go to Ads Manager, click the Tools menu, and select Insights. Then, click on Audience in the left-hand menu.
Alternatively, you can access audience insights directly through Meta Business Suite under the Audience section.
Can I use Facebook posts for research?
You can use public Facebook posts for research by analyzing content, comments, and trends. This is considered ethnographic research. However, you cannot directly ask users for research without their consent. Always get permission before contacting someone for detailed questions.