
Session recording software shows how users move on websites and mobile apps. The best tool depends on your demand or needs. Developers often choose FullStory for its deep technical data.
If your team focuses on mobile apps, Smartlook is a great pick. Contentsquare and Quantum Metric are the top choices for large corporations.
They handle huge amounts of data. Mouseflow is popular for its strong form analytics and heatmaps.
Select the right software. Turn clicks into clear wins. Fast. Simple. Accurate.
How Do You Find the Right Session Recording Software?
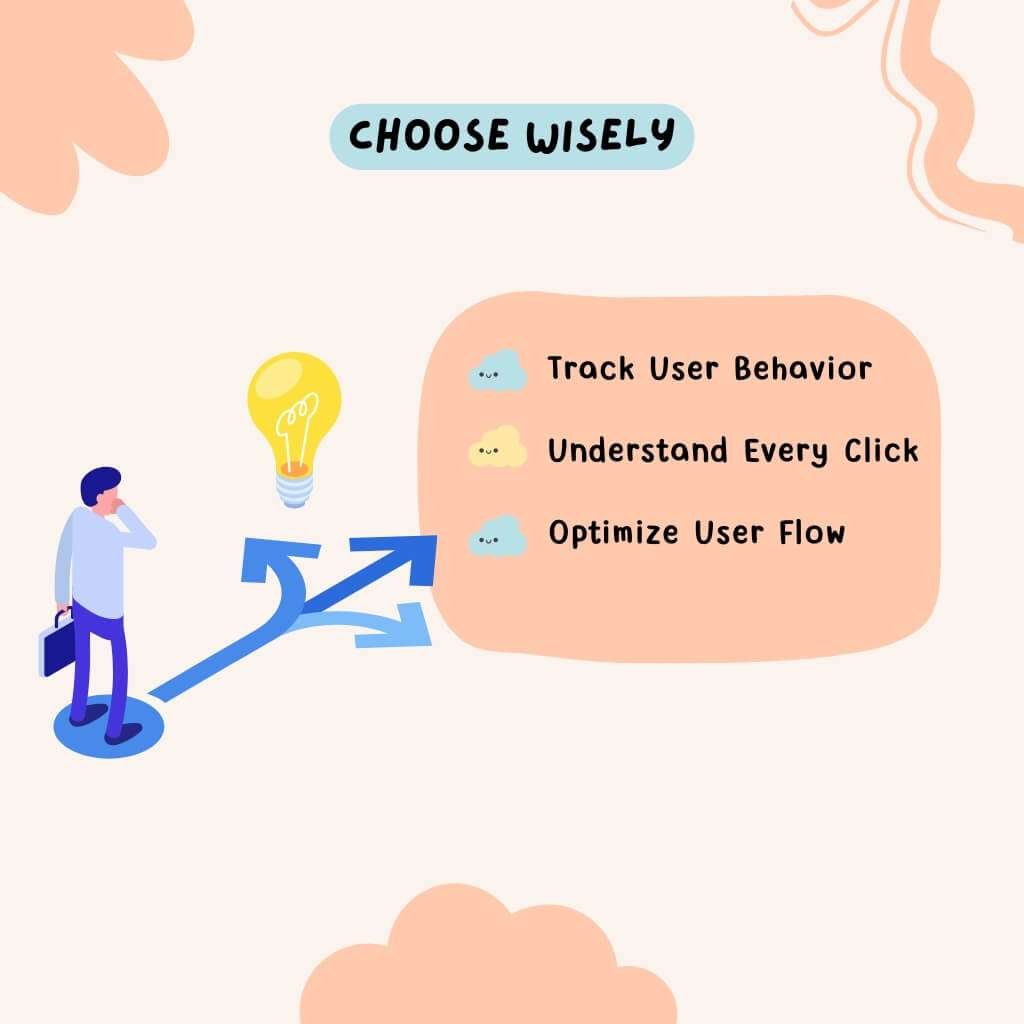
Choosing a session recording tool can be tough. The market is full of options. You need a way to filter them.
Let’s get a few tips for picking a tool:
1 . Check your budget first.
2 . Grant a tool that is easy to install.
3 . Ensure it works with your website platform.
4 . Look for heatmaps and funnels, not just recordings.
5 . Prioritize tools that detect user frustration.
6 . Check if it records all users or only a sample.
7 . Verify it protects user privacy.
8 . See if it offers mobile app recording.
9 . Find out if it tracks errors and technical issues.
10 . Ask about data storage limits.
11 . Read recent reviews
12 . See what kind of support they provide.
Tools to Avoid:
Some tools might not fit your needs. Avoid those with a high price if you have a small team. Some older tools have clunky interfaces.
They make analysis hard. Watch out for tools that have slow website performance. They can hurt your user experience. Don’t pick a tool that samples too many sessions. You might miss important user journeys.
The section below helps you choose a tool that fits your exact needs. It gives you the information you need.
1 . FullStory
Replay user sessions with high accuracy. See every click and scroll. It helps you find and fix issues quickly.
Core Qualities:
Precise Replays: FullStory records every detail. You get a perfect video of the user’s journey.
Powerful Search: Find any session quickly. Search for users who saw an error.
Developer Friendly: The tool links sessions to technical data. Developers can find bugs fast.
AI Insights: Story AI summarizes sessions. It finds behavior patterns for you.
Applying Process:
Find Bugs: Get a bug report. Search for that user’s session. Watch the bug happen. Fix it with the technical data provided.
Improve Features: Launch a new button. Find users who click it. Watch their sessions to see how they use it.
Analyze Behavior: Use the search feature to find user groups. Find all users who added something to their cart but did not buy. Watch their sessions.
Cost Breakdown:
| Plan | Price (Monthly) | Features |
| Free | $0 | 30,000 sessions per month. 10 users. 1-year data storage. |
| Business | Contact Sales | For teams needing more features. The average cost is around $2,350. |
| Enterprise | Contact Sales | For large organizations. Includes advanced features and more users. The price can be from $12,000 to over $150,000 per year. |
2 . Microsoft Clarity
A free tool to see how people use your site. It has unlimited session recordings. Get insights with heatmaps and playbacks.
Defining Characteristics:
Completely Free: Clarity costs nothing. It has no traffic limits. This makes it perfect for any size business.
AI-Powered: AI features give you summaries of sessions. It also detects rage clicks and dead clicks automatically. This saves you a lot of time.
Simple to Use: The interface is very clean. It is easy for anyone to use. You can start getting insights in minutes.
No Data Sampling: Clarity records all user sessions. It does not sample your data. You get a full, accurate picture of your traffic.
Applying Process:
Start for Free: Install the code. It takes just minutes. Start getting data right away.
Filter by Frustration: Look for sessions with rage clicks or high scroll rates. This helps you find unhappy users fast.
Use AI Summaries: Look at the AI-generated summaries. These tell you what happened in a group of sessions. You do not have to watch them all.
Connect with Other Tools: Use Clarity with Google Analytics. Google Analytics tells you which pages have a high bounce rate. Clarity shows you why.
3 . Contentsquare
A platform for large businesses. It provides powerful visual analytics. Discover user behavior with AI and data.
Fundamental Qualities:
Enterprise Power: This platform is built for huge websites. It handles large data volumes. This makes it a go-to for major corporations.
Deep AI: Contentsquare uses AI to find insights. It helps you see user frustration. It also analyzes the impact on revenue. Recent acquisitions have expanded its AI capabilities to include conversation analysis.
Full Journey Analysis: It maps out the entire customer journey. You can see how users move from page to page. It helps you find roadblocks on the way to a purchase.
Visual Storytelling: The tool gives you powerful visuals. This includes heatmaps and a unique “zoning analysis.” It makes it easier to tell your team where problems are.
Applying Process:
Define a Problem: Look for a specific issue. Is a new product page not converting? Go into Contentsquare and analyze its performance.
Use Zone Analysis: Use the zone analysis feature. See which elements get the most clicks. See which ones get ignored. Change your page based on this.
Find Frustration: Look for the AI-driven “struggle score.” Find sessions with a high score. Watch those videos to see what went wrong.
Connect Data: Use Contentsquare with your other tools. Connect it to your CRM or A/B testing platform. This gives you a complete view of your customers.
Pricing:
Prices are custom for each client. The price depends on website traffic and features needed. The price can be very high for large companies.
4 . Quantum Metric
A platform for enterprises. It uses machine learning to find user problems. It helps you fix what’s broken on your site.
Inherent Traits:
AI Analyst: Its “Felix AI” acts as an AI analyst. It finds the “why” behind user actions. It surfaces key moments so you don’t have to search.
Proactive: The tool finds user frustration. It alerts you to issues before they become widespread. It identifies problems without you having to look for them.
Quantified Impact: It ties user behavior to business outcomes. It shows you how much a bug or a change affects your revenue. This helps you prioritize what to fix.
Cross-Platform: Quantum Metric works on websites and mobile apps. It gives you a single view of the customer journey across devices. This is crucial for modern businesses.
Applying Process:
Prioritize Fixes: Look at the quantified impact. See which issues cost you the most money. Fix those first.
Find Bugs: Use the AI to find errors. It flags sessions with problems automatically. Share the link with your developers to fix it fast.
Optimize Funnels: Watch recordings of users who left your funnel. Look for hesitation or confusion. Make changes to the pages based on what you see.
Watch Key Metrics: Set up alerts for important metrics. Get a notification if your checkout completion rate drops. Use the recordings to see why it happened.
Pricing:
Price depends on traffic, features and the number of users. The average annual price is around $280,000. It is a very expensive tool for large enterprises.
5 . Mouseflow
Records every visitor session. It gives you detailed heatmaps. Find where users drop off from forms.
Essential Nature:
Form Analytics: This is a top feature. It shows where users drop off from a form. It tells you which fields they leave blank. This helps you fix forms and get more leads.
Friction Score: Mouseflow uses AI. It gives a “Friction Score” to sessions. This helps you find unhappy users fast. You know which videos to watch first.
Multiple Heatmaps: It gives you several types of heatmaps. You see clicks, scrolls and mouse movements. This gives you a complete view of a page.
Easy to Start: The tool is simple to set up. It has a free plan. You can start collecting data and getting insights quickly.
Applying Process:
Check Your Forms: Go to the form analytics section. Find the fields where users drop off most. Change or remove those fields to increase conversions.
Find Frustrated Users: Filter your recordings by the “Friction Score.” Watch sessions with a high score. See what is making your users angry.
Optimize Your Pages: Look at your heatmaps. Find parts of the page that people ignore. Change the layout. Put important information where people look.
Analyze Funnels: Set up a funnel. Watch recordings of users who left the funnel. You can see exactly why they did not complete the journey.
Cost Breakdown
| Plan | Price (Monthly | Features |
| Free Forever | $0 | 500 sessions/month. 1 website. 1-month data storage. |
| Starter | Starts at $39 | 5,000 sessions/month. 1 website. 3 months of storage. |
| Growth | Starts at $129 | 15,000 sessions/month. 3 websites. 6 months of storage. |
| Business | Starts at $259 | 50,000 sessions/month. 5 websites. 12 months of storage |
6 . Smartlook
Records both website and mobile app interactions. It offers continuous session recording. Find bugs and user patterns.
Basic Principles:
Cross-Platform: Smartlook works for both websites and mobile apps. You get a single tool to analyze all your products. It is great for companies with both.
Continuous Recording: It records every user session by default. You do not miss any data. This gives you a full picture of all your traffic.
Event-Based Funnels: You can create funnels based on user actions. For example, “add to cart” and “checkout.” Then you can watch recordings of users who dropped off at each step.
Retroactive Data: Smartlook tracks events automatically. You can set up a new event for a button click. It will show you data for that button from the past.
Applying Process:
Analyze Your App: Use Smartlook to see how users move through your mobile app. Find where they tap and swipe. Look for confusion.
Build a Funnel: Set up a funnel for your checkout process. Watch sessions of people who do not complete a purchase. This shows you exactly where the problem is.
Find Bugs: Watch recordings of users who experienced a crash. See what they did right before the app broke. This helps developers fix it faster.
Validate Changes: You change a button on your site. Create an event for the new button. Look at the recordings to see if users click it more than the old one.
Cost Breakdown
| Plan | Price (Monthly) | Features |
| Free | $0 | 3,000 monthly sessions. 1,000 video playbacks. 1-month data storage. |
| Pro | Starts at $55 | Up to 200,000 monthly sessions. More storage and features. |
| Enterprise | Contact Sales | For large companies with custom needs. The price is based on usage. |
7 . LogRocket
It combines user recordings with technical data. It’s for developers. See what users do and why it broke.
Primary Assets:
Developer Focus: This tool is made for developers. It records console logs and network requests. This helps them find and fix errors in the code.
Technical Insights: It links user sessions to technical data. You can watch a user’s actions. You can also see what went wrong behind the scenes.
Error Tracking: LogRocket automatically tracks JavaScript errors. It captures crashes and network failures. This helps you find bugs before a user even complains.
Performance Monitoring: It shows you how fast your website loads. You can see how CPU usage affects the user. This helps you find performance issues.
Applying Process:
Debug a Problem: A user reports an issue. Search for their session. See what they did. Look at the console logs and network data. Fix the bug with this information.
Monitor Performance: Check your dashboards for slowdowns. Watch sessions with high load times. See how performance issues affect the user’s experience.
Support a User: A customer needs help. Find their session. See exactly what they are seeing. This helps you solve their problem faster.
Reproduce a Bug: A bug is hard to find. Use LogRocket to filter by specific conditions. Find the sessions where the bug occurred. Watch them to see how it happens.
Cost Breakdown
| Plan | Price (Monthly) | Features |
| Free | $0 | 1,000 sessions per month. 1-month data retention |
| Team | Starts at $69 | For growing teams. 10,000 sessions per month. More users. |
| Professional | Starts at $295 | For product teams. Includes product analytics and advanced features. |
| Enterprise | Contact Sales | For large companies with custom needs. The price is based on usage. |
8 . VWO (Visual Website Optimizer)
A tool for A/B testing and session recording. It helps you see what’s affecting conversions. Analyze visitor journeys to improve results.
Unique Points:
A/B Testing: VWO is famous for A/B testing. It helps you test different versions of a page. You can see which version works better. This is VWO’s main strength.
Integrated Suite: It is more than just a recorder. It has heatmaps, funnels and forms. All these tools work together. They help you analyze your website.
AI Assistant: VWO’s “AI Copilot” gives you suggestions. It can help you create variations for tests. This saves you time and gives you new ideas.
Flexible Pricing: You only pay for users who interact with your experiments. This is a pay-for-usage model. This can be more cost-effective than other pricing models.
Applying Process:
Test Ideas: You think a new headline will get more clicks. Use VWO to create a test. Show the new headline to half your visitors. See which version performs better.
Find Problems: Your A/B test shows one version works better. Use VWO’s session recordings. Find out why the winning version is better. You can see how users interact with it.
Analyze Funnels: Set up a funnel. See where users drop off. Watch their sessions to find out why. Fix the problem in the funnel.
Use AI: Use AI to generate new headlines. Ask it to summarize your test results. Let the AI help you with your work.
Cost Breakdown:
| Plan | Price (Monthly) | Features |
| Starter | Starts at $49 | Unlimited experiments. Basic targeting. 30 days of data retention. |
| Growth | Contact Sales | AI features. No data retention limits. |
| Professional | Contact Sales | Adds more AI features and advanced reporting |
| Enterprise | Contact Sales | For large businesses with complex needs. |
9 . Glassbox
A UXI platform with AI-driven insights. It records every interaction on your app or website. It finds user frustration with a “struggle score.”
Defining Advantages:
AI-Driven Insights: Glassbox uses AI to give you deeper insights. It helps you find user struggles automatically. The tool’s AI assistant, GIA, can summarize reports for you.
Struggle Score: This is a key feature. AI analyzes user actions. It gives a score to each session. A high score means a user is frustrated. You know which videos to watch first.
Enterprise Focused: This tool is for big companies. It handles large amounts of traffic. It has features for security and compliance.
Customer Journey Mapping: The platform shows you the full user journey. You see how users move across your site. This helps you find roadblocks to conversion.
Applying Process:
Spot a Problem: Get an alert from the AI. It tells you there is a problem. Use the struggle score to find the exact videos.
Quantify Impact: See how much a bug costs you. The tool ties user struggle to revenue. This helps you prioritize what to fix.
Find Out Why: Watch the session video. See what a user did before they got frustrated. This tells you what to change on your website.
Simplify Analysis: Use the AI assistant. Ask it questions about your data. It will give you an answer. This saves time on manual analysis.
Pricing:
Price is custom. It depends on your website traffic. It also depends on the features you need. The average annual price is very high for large enterprises.
The Modern Touch: The Role of AI in Today’s Session Recording
AI gives businesses new ways to analyze user data. It helps them find issues much faster than before.
Automated Issue Detection: AI automatically spots user frustration. It finds things like rage clicks and repetitive actions.
This helps you find problems without watching every video. You can then focus on just those videos.
Session Tagging & Summaries: AI analyzes sessions. It then tags them with labels.
These could be “bug report,” “form abandonment,” or “new user journey.” This saves your team hours of manual work. About 85% of professionals now consider AI a must for this.
Predictive Insights: AI can predict user behavior. It looks at past actions. It then tells you what a user might do next. This helps you fix problems before they happen.
Can AI find critical sessions automatically?
Yes, AI finds critical sessions automatically. It is a core function of the best platforms.
AI uses machine learning to score sessions. It looks at user actions for signs of frustration.
It tracks things like rage clicks and erratic scrolling. The AI then flags sessions with a high “frustration score.”
This helps you find problems without watching all sessions. You only review the sessions that matter most.
Beyond the Basics: How Do You Get Real Value?
The real value comes when you connect these recordings with other insights. This is how you move from raw data to clear wins.
What benefits should you look for?
See full user journeys – Understand how people move through your site.
Fix bugs faster – Spot issues quickly and solve them without guessing.
Improve forms – Identify where users drop off and make forms easier.
Increase conversions – Find blockers that stop people from completing actions.
Make better content decisions – Know which pages and sections users focus on.
Align your team – Share recordings so everyone sees the same evidence.
Reduce support load – Solve problems before they reach your support team.
What problems should you avoid?
Relying on recordings alone – Combine with heatmaps and feedback for full context.
Overpaying for features you don’t need – Choose a plan that fits your team size.
Sampling too few sessions – You might miss important user behavior.
Complex dashboards – Avoid tools that are too hard for your team to navigate.
Ignoring funnel analysis – Recordings are better when paired with conversion tracking.
Heavy setup – Avoid solutions that take too long to implement.
Slowing down your site – Some tools can reduce website performance if not optimized.
How do you protect user data and privacy?
Mask Sensitive Information
Automatically hide passwords, credit card numbers and personal identifiers during recordings.
Anonymize User Data
Remove or obfuscate any personally identifiable information (PII) to prevent exposure.
Obtain User Consent
Clearly inform users about data collection and obtain their explicit consent before recording.
Implement Data Encryption
Use strong encryption methods to protect data during transmission and storage.
Set Access Controls
Restrict access to session recordings to authorized personnel only.
Regularly Review Compliance
Ensure adherence to data protection regulations like GDPR, CCPA and HIPAA.
Minimize Data Retention
Store session recordings for the shortest time necessary to achieve business objectives.
Conclusion
Thus, Session recording software turns clicks into insights. Funnels flow like revenue streams. Fixes are bridges over roadblocks. Teams see every move. Growth rises as tools guide each step.
FAQ
What is session recording?
Session recording is a replay of a user journey. It works on both the website and mobile app. It shows clicks, scrolls, taps and errors.
87% of teams use it. 3 of 4 companies fix issues 40% faster with it. Use it with heatmaps and funnels for full insight.
How long should a recording session be?
Most website sessions last 2–4 minutes. Most mobile app sessions last 3–5 minutes. Capture every click, scroll, tap and form action.
Stop recording after the user leaves or closes the app. Store recordings only for analysis, usually 30–90 days.