You run a store doing $45K in revenue. About 32% of buyers come back. That sounds decent.
But do you know which ones drive most of your profit? A customer lifetime value calculator gives you clear numbers.
What is a Customer Lifetime Value Calculator?
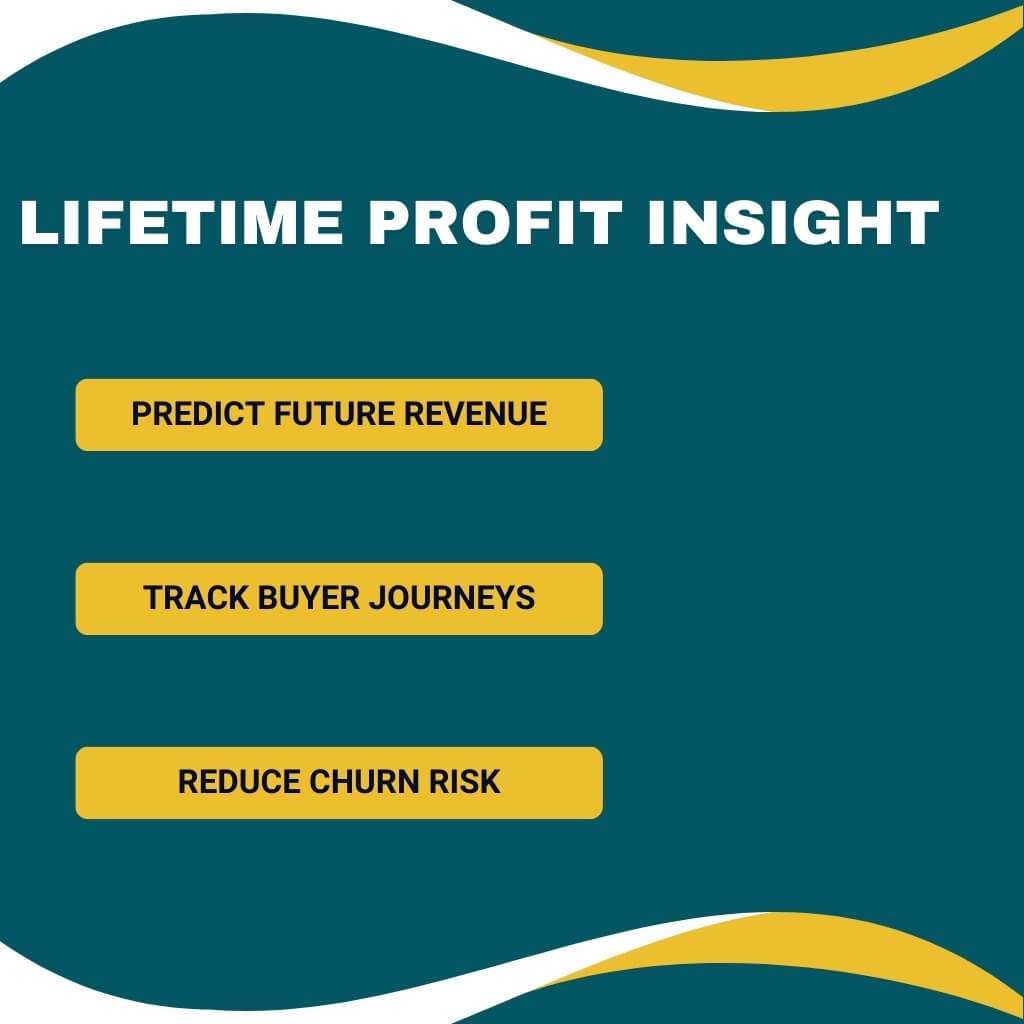
A customer lifetime value calculator shows how much a customer is worth over time. It does not only look at the first purchase. It looks at their full relationship with your business.
It uses simple inputs like average order value, how often they buy, and how long they stay. Then it turns that into one clear number.
For example, a customer may spend $50 on their first order. But if they keep buying for two years, their real value becomes much higher.
Why CLV is a Business Metric
Customer acquisition costs jumped 222% since 2013 and rose 40% in just the last two years. Ads cost more.
Clicks convert less. The old model of buying growth through paid traffic is breaking for most small businesses. Ringly
The answer is not to spend more on new customers. The answer is to get more from the ones you already have.
Businesses that track CLV earn more profit. Harvard Business Review found they make 23% more profit than businesses that only track sales.
CLV Formulas – Quick Reference
E-commerce
Formula: AOV × Frequency × Lifespan
Key driver: Purchase frequency
Subscription
Formula: Monthly Revenue ÷ Churn Rate
Key driver: Churn rate
B2B / Service
Formula: (Annual Contract × Years) − CAC
Key driver: Contract length
Marketplace
Formula: GMV × Take Rate × Lifespan
Key driver: Take rate
Let’s measure the baseline you need right now:
| Metric | 2026 Benchmark / Target |
| Average E-commerce CLV | $100–$300 |
| Subscription Brand CLV | $400–$800 |
| Luxury Goods CLV | $1,500–$2,500 |
| Healthy CLV:CAC Ratio | 3:1 |
| Omnichannel Shopper CLV Premium | +30% |
| Profit Lift from 5% Retention Gain | 25%–95% |
Key Takeaway
Omnichannel integration and a strict 3:1 CLV: CAC ratio remain the core pillars for driving that high-leverage 25%–95% profit lift.
What a Customer Lifetime Value Calculator Shows You
CLV shows how much profit one customer brings to your business over time, which I explained earlier.
Two people each buy from you once for $60. Same revenue. But one returns four times a year for three years.
The other disappears. A customer lifetime value calculator makes that gap visible:
- Buyer A: $60 × 1 purchase = $60 CLV
- Buyer B: $60 × 4 × 3 years = $720 CLV
You cannot treat these two people the same and stay profitable. That 12× difference in value changes every budget decision you make.
Revenue-Based vs. Profit-Based CLV
Most free tools online only show revenue-based CLV. That number looks good, but hides your real margin. Profit-based CLV is the one that drives real decisions.
CLV Calculation Models: Revenue vs. Profit
| Feature | Revenue-Based CLV | Profit-Based CLV |
| What it counts | Revenue only | Revenue minus all costs |
| Speed | One-minute estimate | Needs more inputs |
| Accuracy | Often overestimates results | Shows real business health |
| Best for | Quick benchmarking | Budget and ad spend decisions |
| Example ($100 product) | $100 CLV | $65 CLV after $25 COGS + $10 ad cost |
Takeaway
Revenue-based CLV is useful for a quick overview. But profit-based CLV is better for budget and ad spend decisions. It helps you protect your profit margins and avoid wasting money.
I tracked revenue-based CLV for almost a year on a small DTC brand. The numbers looked good at first.
But when I switched to profit-based CLV, I found two product lines losing money. Returns and ad costs were eating the profit.
We were spending money just to make sales. That discovery completely changed how we used our budget.
Three Formulas: Pick One for Your Business
1. E-Commerce and Retail
CLV = (Average Order Value × Purchase Frequency) × Customer Lifespan
Real example with your numbers ($45K revenue, 32% repeat rate):
- Average order value: $75
- Purchase frequency: 3× per year for repeat buyers
- Customer lifespan: 2.5 years
CLV = ($75 × 3) × 2.5 = $562.50
2. Subscription Business
CLV = Average Monthly Revenue ÷ Monthly Churn Rate
- Monthly plan: $49
- Monthly churn: 4%
CLV = $49 ÷ 0.04 = $1,225
3. B2B and Service Business
CLV = (Annual Contract Value × Customer Years) − Acquisition Cost
- Annual contract: $8,000
- Client stays: 4 years
- Acquisition cost: $1,500
CLV = ($8,000 × 4) − $1,500 = $30,500
Using the right formula for your model is the first step any solid customer lifetime value calculator should walk you through.
Historical CLV vs. Predictive CLV
Old-school CLV looks backward. You pull the purchase history and get a number. It tells you what happened. Predictive CLV looks forward and tells you what to do next.
CLV Methodologies: Historical vs. Predictive
| Feature | Historical CLV | Predictive CLV |
| Data source | Past transactions only | Transactions + behavior + signals |
| Method | Simple formula | Machine learning models |
| Accuracy | Exact for the past | Probabilistic for the future |
| Most useful for | Reporting | Marketing, retention, and budget planning |
| Works for new customers? | No | Yes, via lookalike comparison |
If your tool identifies 200 customers with high future value, you can target them early with a loyalty campaign.
That helps keep them engaged before they leave. Without predictive CLV, you often realize their value only after they are gone. By then, it is too late.
Your Most Important Business Signal: The CLV: CAC Ratio
CAC = Customer Acquisition Cost. This is what you spend to bring in one new buyer. The ratio tells you whether your growth is healthy or a slow cash drain.
CLV to CAC Ratio Health Scale
| CLV: CAC Ratio | What It Means | Strategic Action |
| Below $1:1$ | You lose money on every customer. | Stop scaling immediately. |
| $1:1$ – $2:1$ | You break even. | Overhead makes this unprofitable. |
| $3:1$ | Healthy. | The industry standard benchmark. |
| $5:1+$ | You are under-investing. | You could grow faster. |
Industry CAC benchmarks for 2026:
- E-commerce: ~$70 per new customer
- B2B SaaS: ~$702
- Fintech: ~$1,450
- Arts and entertainment: ~$21
I worked with a SaaS company with a 1.8:1 ratio for two years. Revenue kept growing. The founder thought the business was profitable. It was not.
When we added real overhead and support costs, every new customer was losing money.
We focused on churn. We reduced it by just 3%. The ratio moved to 3.4:1 in one quarter.
How to Find Your Most Valuable Customers Right Now
You do not need expensive software to start. Three methods work at any size.
1. Tier by CLV
Group customers into three buckets:
- Top 10%: High-value — protect these aggressively
- Middle 40%: Growth potential — invest in upsells
- Bottom 50%: Low-value — use low-cost retention or let go naturally
For many online businesses, the top 10% of customers generate more than 50% of revenue.
2. Use your repeat rate as a starting filter
You have a 32% repeat rate. About 1 in 3 customers buy again.
Look at those returning buyers closely. See what they bought first. Check where they came from. Track how fast they came back.
These patterns show what works. Use them as a guide for your next acquisition campaigns.
3. Build a simple “ideal buyer” profile
Look at your top 20 customers by total spend. What do they share: first product, first channel, time to second order? Use that profile to score all new customers from day one.
Customer Lifetime Value Calculator Tools
Most people either pay for platforms they barely use or grab a free calculator that barely scratches the surface. Here is what actually exists and when to use each one.
Best Customer Lifetime Value Tools in 2026
| Tool | Type | Price | Best For | Main Weakness |
| WebFX | Free online | $0 | Quick baseline estimates | No CRM connection |
| Selzy | Free online | $0 | Email marketers | Standalone, no automation |
| UpGrowth | Free online | $0 | CLV:CAC ratio focus | Very limited metrics |
| CleverTap | SaaS platform | From $75/mo | Mobile app businesses | Too costly for small brands |
| Segment | CDP + CLV | From $120/mo | Multi-channel data | Setup complexity |
| Optimove | AI segmentation | Custom quote | Micro-campaigns | Enterprise-focused pricing |
| Amplitude | Product analytics | Free / Custom | SaaS and app businesses | Less useful for pure e-commerce |
| Ajelix | AI spreadsheet | From $9/mo | Excel and Sheets users | No native CRM |
If your store makes under $200K a year, start with a free CLV calculator like WebFX or Selzy. It helps you set a baseline.
Once you know your best customer group, move to tools like Segment or CleverTap. Use them to track customers properly and automate the data.
Connecting CLV to Your CRM Without a Tech Team
Most small businesses have data scattered across three tools that never talk to each other. Here is how to fix it without a developer.
Step 1: Create four fields in your CRM
- First purchase date
- Last purchase date
- Total lifetime spend
- Number of orders
Step 2: Set a rule-based automation
Every time a sale closes, the system automatically totals the lifetime spend and order count. HubSpot, Klaviyo, and Zoho all support this natively with zero coding.
Step 3: Segment by CLV tier
Create three contact lists: high, medium, and low CLV. Build different email sequences for each. Businesses that do this see over 20% higher revenue from their existing customer base. Elementor
Step 4: Review monthly, not yearly
CLV is a moving number. A customer who has been silent for six months might be about to return. Monthly checks keep your campaigns relevant.
What AI Does to a Customer Lifetime Value Calculator
AI does not replace the math in a customer lifetime value calculator. It makes the math faster, sharper, and proactive.
Let’s see what AI adds:
Predicts churn before it happens
AI can spot changes early. It sees when the email opens drop. It sees fewer site visits. It also notices when a customer misses a repeat purchase.
It flags the customer before they leave.
Scores new customers with zero history
A new buyer has no purchase history.
AI studies where they came from. It checks what they browse. It also looks at their location.
Then it matches them with past buyers who act the same way.
Within days of their first visit, it gives a predicted CLV score.
Surfaces micro-segments
AI does not only group customers as “top 10%.”
It finds real patterns. Like people from Instagram who bought product A and opened three emails. These groups often buy 2.7 times more than average.
Gartner expects over 80% of enterprises to use generative AI by 2026.
Companies already using AI for retention see 41% better results than those that do not. Envive
I ran a test on a 3,000-customer email list.
Manual segmentation took four hours. It gave me three segments.
Klaviyo’s predictive analytics took less than 10 minutes. It gave 11 segments.
The top predictive group converted at 3× the rate of my best manual segment.
Five Metrics That Improve CLV Fast
Knowing your CLV number is step one. Raising it is step two. These five metrics do the actual work.
- Gross margin per customer: Track profit, not revenue. A customer with 30% margin is worth more than one spending twice as much at 10%.
- Customer retention rate: A 5% increase in customer retention can boost profits by 25% to 95%, based on Bain & Company research. This is the highest-leverage number in your entire business. Ringly
- Average order value (AOV): A 1% increase in AOV produces roughly a 10% increase in total profit for most e-commerce brands. Upsells, bundles, and threshold-based free shipping all move this number cheaply.
- Purchase frequency: A customer who buys four times a year generates 4× more value than one who buys once at the same order size. Post-purchase email sequences are the cheapest way to raise this.
- Net Promoter Score (NPS): High-NPS customers buy more and refer others. They compound CLV without extra ad spend.
Example: $45K Revenue, 32% Repeat Rate
Let us put this together with your actual numbers.
Inputs:
- Annual revenue: $45,000
- Total customers: 600
- Repeat buyers: 32% = 192 customers
- Average order value: $75
- Repeat buyer order frequency: 3× per year
Revenue breakdown:
- One-time buyers (408 × $75): $30,600
- Repeat buyers (192 × $75 × 3): $43,200
- Repeat buyers contribute ~59% of revenue from just 32% of customers
CLV of a repeat buyer: $75 × 3 × 2.5 years = $562.50 CLV of a one-time buyer: $75 × 1 = $75
The repeat buyer is 7.5× more valuable. Any customer lifetime value calculator run on these numbers tells the same story. Your growth is sitting inside your existing base, not in your next ad campaign.
Moving just 5% of one-time buyers to repeat status adds roughly $17,000 in annual revenue from the same traffic you already pay for.
Fastest Fixes to Raise CLV Starting This Week
No new tools. No bigger budget. These work immediately.
- Send a post-purchase email on day 7. Most brands send a confirmation and go silent. A simple “here is how to get the most from your order” email increases the chance of a second purchase meaningfully.
- Set a free shipping threshold 15% above your current AOV. If your AOV is $65, offer free shipping at $75. Most customers add to their cart.
- Build one loyalty tier for your top 10%. A simple VIP email list with early access costs nothing and keeps high-value customers engaged.
- Ask for a review at day 14. Happy customers leave reviews, and those reviews bring in similar buyers. New visitors from that group usually spend more, which increases your average CLV from new traffic.
- Contact your top 20 customers personally. This takes one hour. The probability of selling to an existing customer is 60–70%, versus just 5–20% for a new prospect. Elementor
Final Word
Your $45K revenue and 32% repeat rate are not the limit. They are just the starting point.
Run the numbers through a customer lifetime value calculator. You will see that most of your value already comes from repeat buyers.
Now focus on finding more of them. Keep them longer. Stop spending on customers who never return.
Start with one free tool. Set your baseline. Then build one simple process. One email. One segment.
One offer to bring customers back. That is how a $45K store can grow toward $90K without doubling ad spend.
Frequently Asked Questions
How do I calculate CLV without fancy software?
Use this formula: Average Order Value × Purchase Frequency × Average Customer Lifespan. If your AOV is $75, customers buy 3× a year, and stay for 2.5 years, your CLV is $562.50. A basic spreadsheet handles this in under five minutes.
What is the difference between CLV and LTV?
Nothing meaningful. CLV (Customer Lifetime Value) and LTV (Lifetime Value) refer to the same metric. Some SaaS companies prefer LTV. E-commerce brands tend to use CLV. The formulas are identical.
5. What CLV: CAC ratio should I aim for?
A healthy CLV to CAC ratio is 3:1. That means each customer should bring three times more value than what you spend to get them.
Below 2:1 is a warning sign. You are spending too much or earning too little per customer.
Above 5:1 means the opposite. You may be under-spending on growth and missing new customers.
How does churn rate affect CLV for subscription businesses?
Churn is the biggest factor that hurts CLV in subscriptions. CLV is Monthly Revenue divided by Churn Rate.
When churn drops from 5% to 3%, CLV rises fast. It can go from $1,000 to $1,667. That is a 67% increase without changing anything else.
Can I calculate CLV for a brand-new customer with no history?
Yes. AI tools do this by comparing a new customer’s acquisition source, browsing behavior, and location to past customers with similar patterns. They produce a predicted CLV score within the first few days of a new signup.
What is the fastest way to increase CLV?
Improve retention first. A 5% increase in customer retention can boost profits by 25–95%.
A post-purchase email sequence at day 7 and a simple loyalty tier for top customers are the cheapest entry points.
How often should I recalculate CLV?
Check CLV monthly for fast-moving ecommerce stores. Check it quarterly for B2B and subscription businesses.
CLV is not fixed. It changes with customer behavior. Big promotions can shift it. Product launches can shift it. Price changes can shift it too.
What data does my CRM need to track CLV?
Four fields cover most of it: first purchase date, last purchase date, total lifetime spend, and number of orders. Most CRMs, including HubSpot, Klaviyo, and Zoho, let you create and auto-update these without coding.
Is profit-based CLV better than revenue-based CLV?
For any real business decision, yes. Revenue-based CLV ignores your costs and inflates the picture. Profit-based CLV subtracts acquisition cost, cost of goods, and marketing spend to show what each customer actually contributes to your bottom line.
Which free CLV calculator is best for small businesses?
WebFX and Selzy both offer free calculators that give you a solid baseline in under two minutes.
WebFX works well for quick revenue-based estimates. Selzy is more useful if you are already running email marketing campaigns and want CLV tied to email channel data. Neither requires a sign-up.

Aliza Khatun is a Digital Marketing Professional and the founder of DigiGenHub. She has helped various businesses grow their online presence through real-world experience in marketing, branding, traffic growth, and business strategy.
Through DigiGenHub, she shows how to build and grow a business from the ground up using Website Setup, SEO, Branding, Paid Promotion, and smart digital tools.
She also highlights how AI can be used to its full potential to make content creation, automation, marketing, and business growth faster and smarter.
She believes that the right knowledge, modern technology, and the right tools can help any individual or business build a stronger online presence.